The Future of Trading in Financial Markets
In today’s world, financial markets are rapidly evolving, and technology plays a key role in these changes. One of the most notable innovations in this field is algorithmic trading. This method allows investors and traders to automatically and optimally engage in financial markets using computer programs and complex algorithms.
What is Algorithmic Trading?
Algorithmic trading refers to the process of buying and selling assets in financial markets using mathematical algorithms and computer programs. This method aids in analyzing market data and identifying price patterns, enabling traders to make quick and accurate decisions. Algorithms can be designed based on various criteria, such as trading volume, price volatility, and even economic news.
Converting Flowchart Analysis to Code and Back testing
Introduction
Converting flowchart analysis into code is a key step in the development of algorithmic trading strategies. This process allows us to implement our ideas practically and evaluate their performance under historical market conditions. Back testing helps us identify the strengths and weaknesses of our strategies and make better decisions for optimizing them.
Steps to Convert Flowchart to Code
- Analyze the Flowchart: First, carefully review your flowchart analysis. Each step and decision in the flowchart should be clearly defined. This includes entry and exit conditions, risk management, and other key parameters.
- Choose a Programming Language: Select an appropriate programming language for implementation. Common languages for algorithmic trading include Python, R, and C++. Python is one of the most popular choices due to its simplicity and the availability of various libraries.
- Write the Code: Based on the flowchart, write your code. This code should include decision-making logic, entry and exit conditions, and risk management. For example, you can use libraries like Pandas and NumPy in Python for data analysis and calculations.
- Test the Code: After writing the code, test it to ensure it works correctly. This step involves checking for errors and ensuring that the code accurately implements the logic of the flowchart.
Back testing
- Gather Historical Data: For back testing, you need historical market data. This data should include prices, trading volumes, and other relevant information. You can use various sources like Yahoo Finance or Alpha Vantage.
- Run the Back test: Using the written code and historical data, perform the back test. This step involves executing your strategy on past data and recording the results. You can calculate various metrics such as returns, Sharpe ratio, and maximum drawdown.
- Analyze the Results: After running the back test, analyze the results. Check whether your strategy performed well or not. Identify strengths and weaknesses and make optimization decisions based on them.
- Optimize the Strategy: Based on the back test results, you can optimize your strategy. This includes adjusting parameters, refining decision-making logic, and testing new strategies.
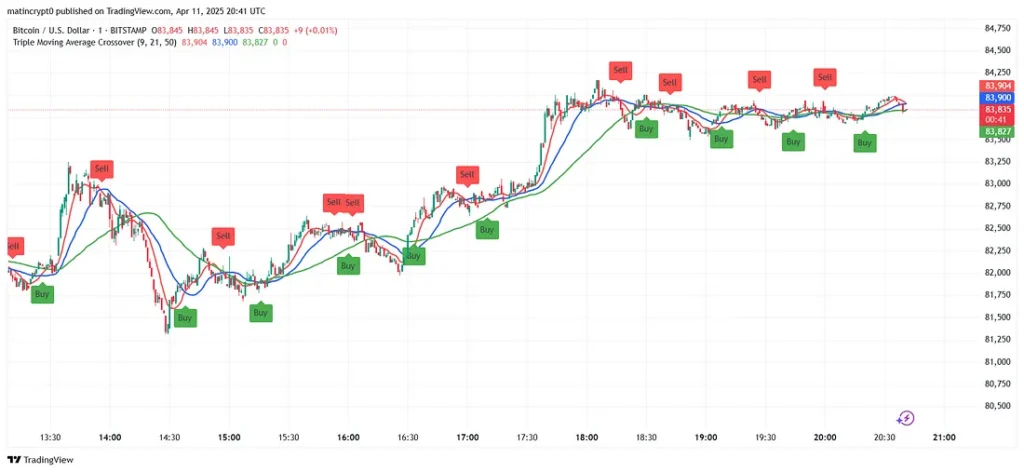
Practical Example: Using Moving Averages to Generate Buy and Sell Signals
In this section, we will provide a practical example of using moving averages to generate buy and sell signals. This example will help you understand how to implement trading strategies using Pine Script code.
Suppose we want to use three moving averages with different lengths: a short moving average (9 periods), a medium moving average (21 periods), and a long moving average (50 periods). Our goal is to generate buy and sell signals based on the crossover of these moving averages.
//@version=5
indicator("zero trade", overlay=true)

// Define parameters for the three moving averages
shortLength = input(9, title="Short MA Length") // Length of the short moving average
mediumLength = input(21, title="Medium MA Length") // Length of the medium moving average
longLength = input(50, title="Long MA Length") // Length of the long moving average


// Calculate moving averages
shortMA = ta.sma(close, shortLength) // Short moving average
mediumMA = ta.sma(close, mediumLength) // Medium moving average
longMA = ta.sma(close, longLength) // Long moving average


// Plot moving averages on the chart
plot(shortMA, title="Short MA", color=color.red, linewidth=2)
plot(mediumMA, title="Medium MA", color=color.blue, linewidth=2)
plot(longMA, title="Long MA", color=color.green, linewidth=2)


// Generate buy and sell signals
buySignal = ta.crossover(shortMA, mediumMA) // Buy signal: short MA crosses above medium MA
sellSignal = ta.crossunder(shortMA, mediumMA) // Sell signal: short MA crosses below medium MA


// Plot signals on the chart
plotshape(buySignal, style=shape.labelup, location=location.belowbar, color=color.green, size=size.small, title="Buy Signal", text="Buy" , textcolor = color.black)
plotshape(sellSignal, style=shape.labeldown, location=location.abovebar, color=color.red, size=size.small, title="Sell Signal", text="Sell" , textcolor = color.black)


// Alerts
alertcondition(buySignal, title="Buy Alert", message="Buy Signal: Short MA crossed above Medium MA")
alertcondition(sellSignal, title="Sell Alert", message="Sell Signal: Short MA crossed below Medium MA")
Below is the Pine Script code for this strategy:
Code Explanation:
- Parameter Definition: In this code, the lengths of the three moving averages are defined as input parameters that the user can modify.
- Calculating Moving Averages: The short, medium, and long moving averages are calculated using the
ta.smafunction. - Plotting Moving Averages: The moving averages are plotted on the price chart so that we can observe the crossovers.
- Generating Buy and Sell Signals: Buy and sell signals are generated using the
ta.crossoverandta.crossunderfunctions. - Plotting Signals: The buy and sell signals are plotted as labels on the chart.
- Alerts: Alerts are defined for the buy and sell signals so that the user is notified when these signals occur.
Enhancing Speed and Accuracy in Trading
By implementing moving averages and utilizing automated signals, we significantly enhance both the speed and accuracy of our trading decisions. The ability to quickly identify crossovers and generate buy and sell signals allows traders to react promptly to market changes, minimizing the risk of missing profitable opportunities.
Moreover, this systematic approach reduces the emotional stress often associated with trading. By relying on predefined rules and automated signals, traders can make decisions based on data rather than emotions, leading to more rational and informed choices.
Conclusion
In summary, using moving averages and automated trading strategies not only improves the speed and accuracy of our trading but also helps in reducing stress. This combination allows traders to navigate the complexities of the financial markets with greater confidence and efficiency. By leveraging technology, we can focus on developing our strategies and optimizing our performance, ultimately leading to a more successful trading experience.
We would like to thank the Zero Trade team for their support and collaboration in producing this article.
Ino test kardam cheghadr khhhob bod
555